Showing posts with label Power BI. Show all posts

Wednesday, 2 July 2025

How to get PowerBI Embed Token

 Here's a step-by-step guide to help you through the process.

Step 1: Register Your App in Azure

  • 1. Go to Azure Portal → App registrations
  • 2. Register a new app.
  • 3. Provide necessary API permissions
  • 4. Go to Certificates & secrets → Generate a Client Secret


Step 2: Assign the App to the Power BI Workspace

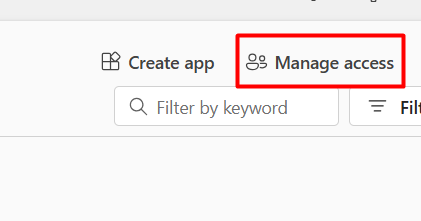
1. Go to Power BI Service
2. Click Workspace access
3. Add the App's Service Principal(App Registration ClientId) as an Admin or Member


Step 3: Get Access Token 

Request:

 Method: POST
 URL: https://login.microsoftonline.com/{tenant-id}/oauth2/v2.0/token


Headers:
Content-Type: application/x-www-form-urlencoded 

Body: (x-www-form-urlencoded):

grant_type=client_credentials
client_id={your-client-id}
client_secret={your-client-secret}
scope=https://analysis.windows.net/powerbi/api/.default


Endpoint will provide you with an Access Token


Step 4: Generate the Embed Token


URL: Post Endpoint 

https://api.powerbi.com/v1.0/myorg/groups/{groupId}/reports/{reportId}/GenerateToken


Headers

Authorization: Bearer <access_token>
Content-Type: application/json

Body

{
  "accessLevel": "View"
}


Sample Code to embed the PowerBI Report in an HTML Page


<script src="https://cdn.jsdelivr.net/npm/powerbi-client@2.21.1/dist/powerbi.min.js"></script>

<style>
    #reportContainer {
      width: 100%;
      height: 800px;
      border: 1px solid #ccc;
    }
  </style>

<div id="reportContainer"></div>

<script>
  
    const embedToken = "Call the APIs and pass the token here";
    
    const embedUrl = "https://app.powerbi.com/reportEmbed?reportId=report id here&groupId=group id here";

    const reportId = "your report Id here";

    // Embed configuration
    const config = {
        type: 'report',
        id: reportId,
        embedUrl: embedUrl,
        accessToken: embedToken,
        tokenType: window['powerbi-client'].models.TokenType.Embed,
        settings: {
            filterPaneEnabled: false,
            navContentPaneEnabled: true
        }
    };

    const reportContainer = document.getElementById('reportContainer');

    // Embed the report
    const powerbi = new window['powerbi-client'].service.Service(
        window['powerbi-client'].factories.hpmFactory,
        window['powerbi-client'].factories.wpmpFactory,
        window['powerbi-client'].factories.routerFactory
    );

    powerbi.embed(reportContainer, config);
</script>


Power BI - PowerBIEntityNotFound Error in Embed Report

Typically, PowerBIEntityNotFound indicates that the requested resource (report, dataset, or workspace) could not be found under the access token's permissions. 


{
    "error": {
        "code": "PowerBIEntityNotFound",
        "pbi.error": {
            "code": "PowerBIEntityNotFound",
            "parameters": {},
            "details": [],
            "exceptionCulprit": 1
        }
    }
}


You need to check a couple of things.

1. Ensure the workspace GUID is accurate. 


You can find it in the URL when viewing a report:
https://app.powerbi.com/groups/{workspace-id}/reports/{report-id}

2. Is the Report ID correct?

    same steps as above.

3. Does the service principal have access?

Your Azure AD app (service principal) must be added to the workspace as a member or admin:

Go to Power BI Service → Workspace → Access
Add the service principal (client ID) as a Member or Admin


4. Ensure service principal access is enabled in tenant settings


In Power BI Admin Portal: Go to Tenant settings

Enable:
"Allow service principals to use Power BI APIs"
"Allow service principals to create embed tokens."

5. Ensure you are using the correct scope and authority in the token request.

SCOPE = "https://analysis.windows.net/powerbi/api/.default"

Check all the above steps, and it will resolve the issue.

Wednesday, 31 March 2021

Power BI – Get data from SQL Server Custom Query and display in Table, Matrix and Decomposition Tree

In this article, we will learn how to get data from SQL Server and display it in various visualizations 
Let's create some tables in our SQL database and insert some records. Here I'm going to create 2 new tables in SQL Server i.e. Country and State.


CREATE TABLE [dbo].[Country](
[CountryId] [int] NOT NULL,
[CountryName] [varchar](100) NOT NULL

CREATE TABLE [dbo].[State](
[StateId] [int] NOT NULL,
[CountryId] [int] NOT NULL,
[StateName] [varchar](50) NOT NULL,
)

INSERT [dbo].[Country] ([CountryId], [CountryName]) VALUES (1, N'India')
INSERT [dbo].[Country] ([CountryId], [CountryName]) VALUES (2, N'Srilanka')

INSERT [dbo].[State] ([StateId], [CountryId], [StateName]) VALUES (1, 1, N'Punjab')
INSERT [dbo].[State] ([StateId], [CountryId], [StateName]) VALUES (2, 1, N'Himachal')
INSERT [dbo].[State] ([StateId], [CountryId], [StateName]) VALUES (3, 2, N'Colombo')


Now our tables are ready and we have records. Let's write SQL Query to fetch the records.


SELECT c.CountryId,c.CountryName,st.StateId,st.StateName FROM country c 
INNER JOIN state st on c.CountryId=st.CountryId

Let's Open Power BI and fetch the records through a custom query.

Step 1: Click on Get data --> Go to SQL Server


Step 2: Select your Server, Database and Go to Advance and write Custom Query


Step 3: Enter your credentials. If you are using windows authentication for the database then click "Use my current credentials"


Step 4: Once you press connect it will display all the records. You can press the Transform data button if you want to Add/Edit rows/columns. Otherwise, press the Load button.


You can go to Visualizations and can add Charts, Table, Matrix, etc. Here in this example, we will add a table. Double click on the Table icon.


Table Visualization


Step 1: Go to Visualizations and select Table.


Step 2: Drag the Fields in Values in Visualizations. You can see the records on the left side.


Step 3: You can format the data, By clicking on the format and change the format.


Decomposition Tree


Step 1: Go to Visualizations and select Decomposition Tree.

Step 2: You can display the data in Tree. Drag the column in Analyze and Explain By


You can see the Country and State in Tree mode as mentioned above.


Matrix


Step 1: Go to Visualizations and select Matrix.
Step 2: Drag the Fields based on your requirement. In this example, I have displayed countries name and state count.


You can't format the result as we did in the first example. You can change the font, color, background, Header, etc.

Also, you can publish the report to the Web then you can click the publish button and connect with your credentials and Publish to Power BI.


This is all about this article. thank you.

How to get PowerBI Embed Token

 Here's a step-by-step guide to help you through the process. Step 1: Register Your App in Azure 1. Go to Azure Portal → App registratio...